
Facebook, Twitter and Instagram alike offer several in app analytics tools that are insightful and easy to use. These analytics show how well your social is performing and we want to make sure you’re using them! So, we’re breaking them down here.
Facebook:
- Promotions
A great aspect of social media analytics is that you can promote or "boost" your posts for a certain period of time and target your posts for people from specific interests, ages, genders, industries and more. After promoting a post, you can view how well it does and compare it to other posts.
Ex: You may try boosting a video post and an image/link post and compare the results so that you can develop a more sophisticated understanding of what works best.
- Actions on Your Page
This tool allows you to see how many people have clicked your "Action" buttons on your page or posts. It gives you an overview of who clicked direct links, your website, your phone number, and any other actions. It goes even more into depth by showing you these numbers by age and gender, country, city, and device type.
- Pageviews
This section allows you to view how many people view your page across any period of time. You can filter these results also by age and gender, country, city, and device type but also by section. Some section examples are home, issues, jobs, live videos, custom, and other. These give you a decent understanding of the reasons people are viewing your page.
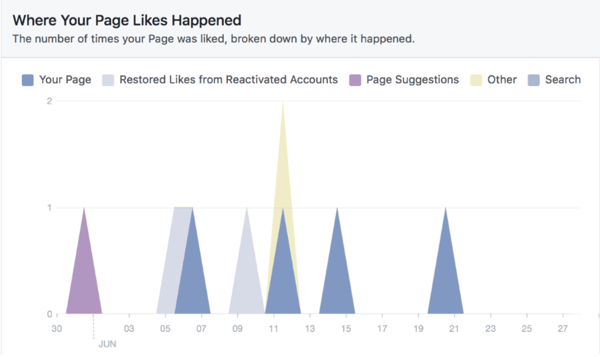
- Page Likes
This tab allows you to see the total number of page likes you have now as well as at any time in the past - making it easy for you to compare your growth. You can also see your net likes which encompasses organic likes, paid likes, and unlikes. An even further insight allows you to see where each like happened such as on your page, searches, suggestions, and reactivated accounts.
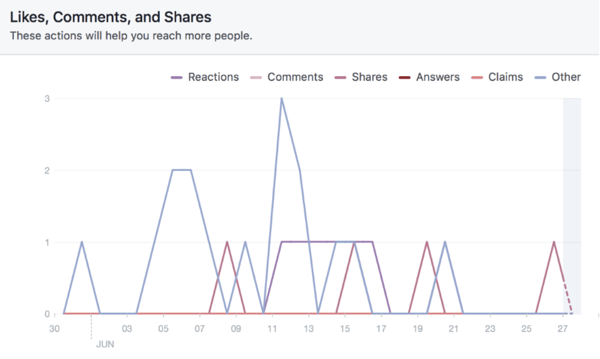
- Reach
Viewing your reach using the Facebook analytics tool lets you see the number of people who had any posts from your Page enter their screen, both paid and organic. You can also view the number of people who have ever recommended your page on Facebook as well as total likes, comments, and shares of your posts across time.
- Pages like Yoursto Watch
This is a simple tool that shows you similar pages to yours categorized by your location, interests, and industry. Facebook shows you pages that have many followers, promote their posts, and receive a lot of engagement. When you "watch" a page you can view their success as inspiration for your own page!
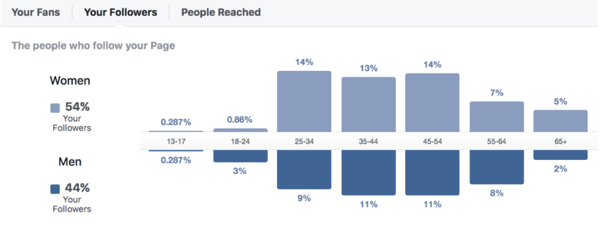
- Demographics
Here you can view the age, gender, and general location of your fans, followers, and people you reach. This is a great tool because it makes it easier for you to understand the type of people seeing your posts/page so that you may optimize your posts accordingly.
Twitter:
- Promotions
Like Facebook, you can promote your tweets on twitter to show up on the pages of people who you decide to present yourself to. This allows you a far greater reach and exposure to people who you may not have had the chance to reach before. You can view and analyze the results of each promoted tweet to better understand what is working for you and what is not.
- Top Tweets
Twitter analytics puts a list of your top tweets together by organizing them into top impressions, engagement, and engagement rate. You can also view your average retweets, website clicks, and tweet replies. Viewing how many impressions you earn is very helpful because it shows you the number of times any user saw your tweets, giving insight on if you are improving and if you are making your goals.
- Audience Demographics
Twitter audience demographics allows you to see many insights into the type of people viewing your tweets. You can see your audience's age, gender, average household income, country and region, home value, and language. By creating a better understanding of who is most interested in your posts, you can start to segment your market so that each post is optimal.
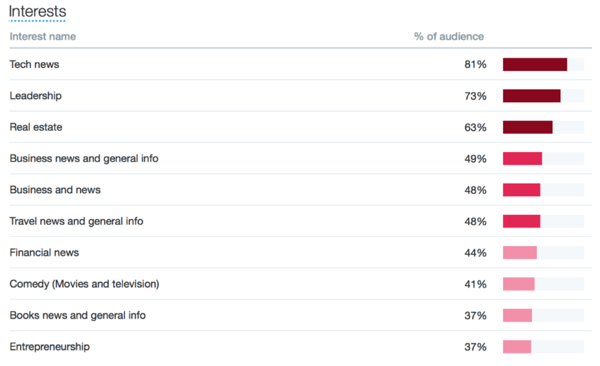
- Audience Interests
Audience interests allows you to see the percent of your audience that has the most interest in different interest categories. Some examples are tech news, leadership, real estate, business news and general info, travel, and entrepreneurship. Once again this will allow you to make smarter decisions when deciding what to post.
- Consumer Behavior
Consumer behavior shows you the type of consumer your followers are most likely to be. It can range from premium brands to quick and easy. You can see the types of restaurants your followers are likely to attend as well as their automotive buying and using habits.
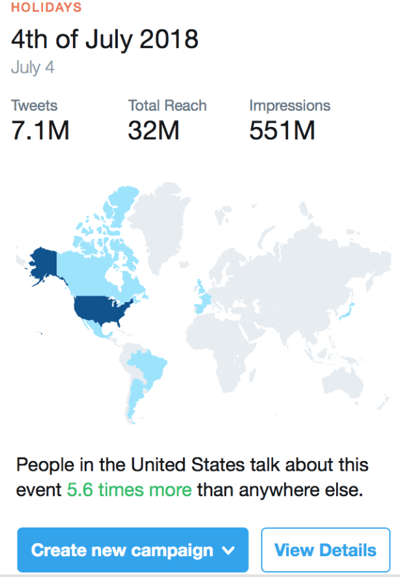
- Trending Events / Hot Topics
Trending events shows you what events or topics are the most popular on twitter at a certain time. Influencers often use this to decide when they are going to tweet about what. This is a useful tool because if you want to mix up your tweet content, you can use this to decide what types of topics will get you the most impressions.
Instagram:
- Activity
The activity tab is the first of the three analytics insight tabs you can view on Instagram. You can see your interactions, which are the total taps on your post or profile, reach, which is the number of users that have seen any of your posts, and any new, recent or total profile views by any user.
- Content
This tab gives you feedback on your most seen posts and posts with the most engagement. You can also see similar information about your Instagram stories. The content tab is also important because here you can view how well your promoted posts are doing. Because Instagram is owned by Facebook, their post promotion/ boost techniques are very similar and allow you to categorize your audience so that each post is optimized.
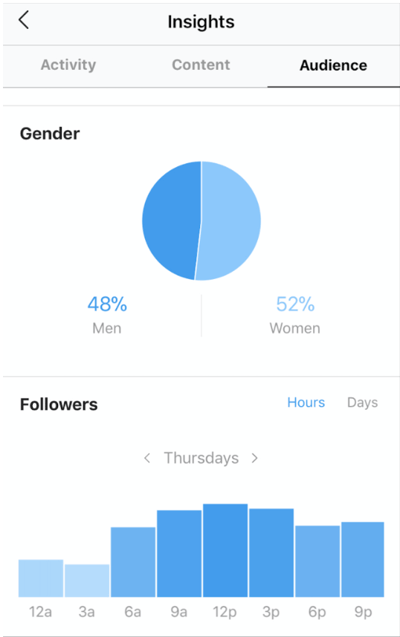
- Audience
The audience tab shows you the demographics of your followers. It provides you with information such as top locations, top age range for women and men, gender, and the most frequent times and days your followers are active on Instagram. The latter statistic is especially key because it gives you a really good idea of the best times to post! Using this tool should help you increase the amount of reach and engagement you receive on your posts.