


We know reading statistics and survey results aren't the most glamorous forms of marketing, but doing research on your market (as well as your competition) is key when trying to stay competitive in today's market. The National Association of Realtors recently published the Home Buyer and Seller Generational Trends Report 2017. This report is filled with valuable statistics about buyers, sellers, and industry trends from 2017. We’ve pin pointed some key pieces of information from this report and analyzed the data to see what this 2017 report means for you.
Source: National Association of REALTORS® Research Department
Reasons for Buying/Selling:
- 34% of recent buyers who purchased new homes were looking to avoid renovations and problems with plumbing or electricity.
- For buyers 36 years and younger, 48 %bought new homes to avoid renovations and problems compared to 18% of buyers 71 years and older.
- For buyers under 61, the main reason for purchasing was the desire to own a home of their own.
- Among the 62 to 70 age group, the desire to be closer to friends and family and retirement were the top two reasons to purchase at 19%.
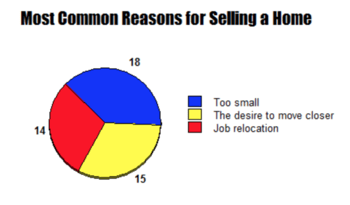
- For all sellers, the most commonlycited reason for selling their home was that it was too small (18 percent), followed by the desire to move closer to friends and family (15 percent), and a job relocation (14 percent).
What do these statistics mean for you?
It is important to consider the wants and needs of both buyers and sellers, as you know. But these facts point out the specifics of your possible target markets. Also, once approached by a new possible client, it is important to know in advance the type of homes they would be more inclined to see.
Agent Referrals
- 88% of all buyers purchased their home through an agent.
- Referrals continue to be the way that most buyers find their real estate agent.
- When choosing an agent to work with, working with an agent that is honest and trustworthy was the most important factor for buyers.
- Nearly 7in 10 buyers interviewed only one real estate agent during their home search, consistent across all generations.
- 88%of buyers would use their agent again or recommend their agent to others, also consistent across all generations.
- 64%of recent home sellers used a referral or the same real estate agent they had worked with in the past.
- The typical seller has recommended their agent twice since selling their homeand 33% of sellers recommended their agent three or more times since selling their home.
What do these statistics mean for you?
First off, after reading these facts, it is apparent that you need to look at your client lists and consider investing in ways to strengthen it with valuable leads. If your lead generation is not as high as you think it should be, consider ways you can start encouraging your clients to recommend you more such as incentives or different digital marketing tactics. Based off these facts from 2017, both buyers and sellers are willing to recommend and reuse their agents, so reach out and make it easy for them too!
Buyer/Seller Demographics:
- First-time buyers made up 35%of all home buyers
- The37 to 51 age group showed to be the most racially diverse group of homebuyers in 2016. Twenty-one percent of this group of homebuyers identified as Hispanic/Latino, black/African American, or Asian/Pacific Islander.
- Sellers 37 to 51 years made up 29%of all sellers
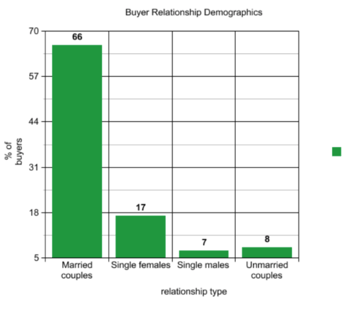
- 66%of recent buyers were married couples, 17% were single females, 7% were single males, and 8% were unmarried couples.
What do these statistics mean for you?
Any opportunity to look at demographic statistics is good because it allows you to have a general knowledge of what you can expect of your target market. Similarly, demographics can be useful because they can allow you to compare the scores from the population to that of your own community.
Community:
- There was only a median of 12 miles between the homes that recent buyers purchased and the homes that they moved from.
- For buyers 62 to 70 years, the median distance was 25 miles and for buyers 51 and younger the median was 10 miles.
- 72% of all sellers moved within the same state.
What do these statistics mean for you?
These facts should be great evidence for you to conclude that you need to expand your self-brand in your community. If buyers aren’t looking to move too far, that keeps them in your community and makes them potential clients again. Keep an eye out in your neighborhood to see how far most buyers plan to move.